
WinDbg // ServiceDescriptorTable 내용 확인하기
우선, 커널 변수를 이용하여, 테이블 위치 확인
8055c700 80504450 00000000 0000011c 805048c4
8055c710 00000000 00000000 00000000 00000000
8055c720 00000000 00000000 00000000 00000000
8055c730 00000000 00000000 00000000 00000000
8055c740 00000002 00002710 bf80c0b6 00000000
8055c750 f719ba80 f6b89b60 86d74950 806f60c0
8055c760 00000000 00000000 ffea8ad6 ffffffff
8055c770 ee4ae396 01c90284 00000000 00000000
8055c6c0 80504450 00000000 0000011c 805048c4
8055c6d0 bf999b80 00000000 0000029b bf99a890
8055c6e0 00000000 00000000 00000000 00000000
8055c6f0 00000000 00000000 00000000 00000000
8055c700 80504450 00000000 0000011c 805048c4
8055c710 00000000 00000000 00000000 00000000
8055c720 00000000 00000000 00000000 00000000
8055c730 00000000 00000000 00000000 00000000
KeServiceDescriptorTable 에서, NtOsKrnl 에 연결된 서비스.
KeServiceDescriptorTableShadow 에서, Win32K 에 연결된 서비스 를 확인 할 수 있다.
{
PULONG ServiceTable; // array of entry-points
PULONG puCounterTable; // array of counters
ULONG uTableSize; // number of table entries
PUCHAR pbArgumentTable; // array of byte counts
} SERVICE_DESCRIPTOR_TABLE, *PSERVICE_DESCRIPTOR_TABLE;
ServiceDescriptorTable의 구조가 위와 같으므로,
앞의 SDT에서는
ServiceTable Array of Entry 가 80504450
Entry의 개수는 0000011c 개 임을 알 수 있다.
출력하여 보면
80504450 805a4614 nt!NtAcceptConnectPort
80504454 805f0adc nt!NtAccessCheck
80504458 805f4312 nt!NtAccessCheckAndAuditAlarm
8050445c 805f0b0e nt!NtAccessCheckByType
80504460 805f434c nt!NtAccessCheckByTypeAndAuditAlarm
80504464 805f0b44 nt!NtAccessCheckByTypeResultList
80504468 805f4390 nt!NtAccessCheckByTypeResultListAndAuditAlarm
8050446c 805f43d4 nt!NtAccessCheckByTypeResultListAndAuditAlarmByHandle
80504470 806153a2 nt!NtAddAtom
...
위와 같이 List를 확인할 수 있다.
덧붙혀, 위의 순서가 바로 서비스 Index가 된다.
Detecting & Defeating the Debuggers
원문 : http://nagareshwar.securityxploded.com/2007/07/15/detecting-defeating-the-debuggers/
Debuggers are the main tool used in reverse engineering. It is used by serial crackers to break the software protection or to uncover the algorithm used in the proprietary applications. On the other hand it is also used by researchers to analyze the malwares.
Detecting the presence of debuggers is an important step in this direction. Here I will discuss about both user land and kernel level debugger detection techniques. Also I will throw some light on how one can defeat these techniques. Its always good to know both sides of the coin even though you always sit on one side.
In user land
Detecting debuggers in user land (ring 3) is simple. Windows provides API IsDebuggerPresent() which indicates if the application is being debugged. In such a case application may decide to terminate or may take different path just to evade the crackers.
There is a better method than one mentioned above. This involves directly reading ‘beingDebugged’ flag of PEB of the process. It is more stealthier than directly using the function since the function entry is clearly visible in the import table. In fact the IsDebuggerPresent() function internally does the same thing of reading the flag from PEB.
Here is the disassembly of IsDebuggerPresent Function
mov eax, dword ptr fs:[18]
mov eax, dword ptr ds:[eax+30] ; eax now points to PEB
movzx eax, byte ptr ds:[eax+2] ; retrieves PEB->beingDebugged value
Bypassing the above detection is simple as well.You can just attach debugger and modify the return value of IsDebuggerPresent(). You can also directly modify the ‘beingDebugged’ value in PEB. OllyDbg has several plugins which does this automatically.
This technique of detecting debuggers is pretty old, but it still helps in evading casual crackers. Now there are most customized methods specific to debuggers such as OllyDbg, IDAPro, Softice etc.
You can find some very good techniques at OpenRCE.
Inside the Kernel
There are very less resouces available online when it comes to kernel as very few people have dared to enter ring 0. However windows provides support for detecting and defeating the debuggers inside kernel. You can use exported variable KdDebuggerEnabled of ntoskrnl to detect if the machine is being debugged by kernel debugger. The good place to perform this check in the DriverEntry routine of your driver.
Once the debugger is detected, you can either terminate execution of your driver or disable the debugger itself. To stop the debugger, you can use another exported function KdDisableDebugger on NT based machines.
This same trick is used by IceSword (anti rootkit tool) to prevent reversers from knowing its internals.Here is the code snippet from IceSword driver Isdrv120.sys which does this check and then disables the debugger.
| loc_disable_debugger: | |
| mov eax, ds:KdDebuggerEnabled | ; check if debugger running |
| cmp byte ptr [eax], 0 | |
| jz short loc_next | ; no debugger found |
| call KdDisableDebugger | ; disable debugger |
| jmp short loc_disable_debugger | ; check again, until it is disabled |
| loc_next: |
However inside the ring 0 also its not rare to find debugger specific checks. For example, you can test for the presence of SoftIce by checking if its driver is loaded or not.
- Nagareshwar
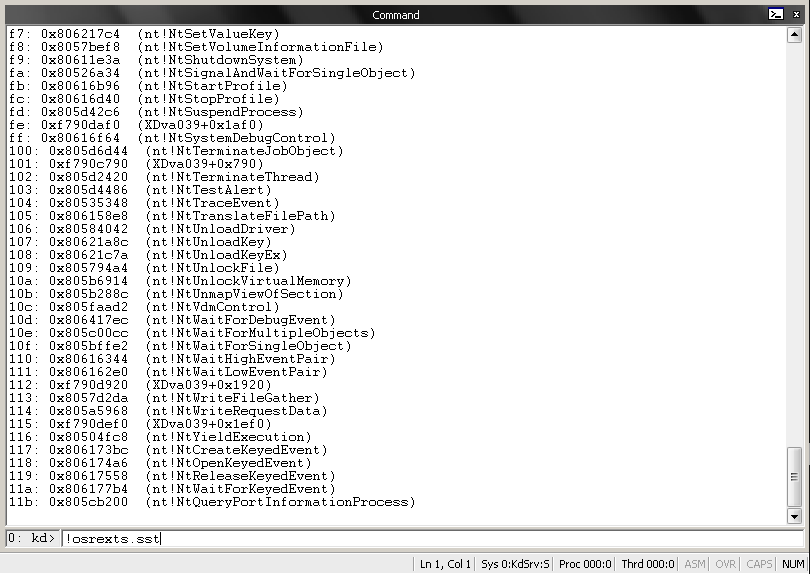
WinDBG // Service Descriptor Table 확인하기
KD> !osrexts.sst
Kernel 에서 EPROCESS 기준으로 HandleTable 찾기
~ System Process 의 PID가 4이므로, 4번 PID 의 EPROCESS 확인
Searching for Process with Cid == 4
PROCESS 867b5830 SessionId: none Cid: 0004 Peb: 00000000 ParentCid: 0000
DirBase: 06e40020 ObjectTable: e1003ea8 HandleCount: 1321.
Image: System
~ 디버거에서 ObjectTable 을 반환하지만
~ EPROCESS 구조체에서 직접 확인
+0x000 Pcb : _KPROCESS
+0x06c ProcessLock : _EX_PUSH_LOCK
+0x070 CreateTime : _LARGE_INTEGER 0x0
+0x078 ExitTime : _LARGE_INTEGER 0x0
+0x080 RundownProtect : _EX_RUNDOWN_REF
+0x084 UniqueProcessId : 0x00000004
+0x088 ActiveProcessLinks : _LIST_ENTRY [ 0x86476558 - 0x805627b8 ]
+0x090 QuotaUsage : [3] 0
+0x09c QuotaPeak : [3] 0
+0x0a8 CommitCharge : 7
+0x0ac PeakVirtualSize : 0x537000
+0x0b0 VirtualSize : 0x1e4000
+0x0b4 SessionProcessLinks : _LIST_ENTRY [ 0x0 - 0x0 ]
+0x0bc DebugPort : (null)
+0x0c0 ExceptionPort : (null)
+0x0c4 ObjectTable : 0xe1003ea8 _HANDLE_TABLE
+0x0c8 Token : _EX_FAST_REF
+0x0cc WorkingSetLock : _FAST_MUTEX
...
~ HandleTable 값 확인
nt!_HANDLE_TABLE
+0x000 TableCode : 0xe18b3001
+0x004 QuotaProcess : (null)
+0x008 UniqueProcessId : 0x00000004
+0x00c HandleTableLock : [4] _EX_PUSH_LOCK
+0x01c HandleTableList : _LIST_ENTRY [ 0xe1010f84 - 0x80563aa8 ]
+0x024 HandleContentionEvent : _EX_PUSH_LOCK
+0x028 DebugInfo : (null)
+0x02c ExtraInfoPages : 0
+0x030 FirstFree : 0x1740
+0x034 LastFree : 0
+0x038 NextHandleNeedingPool : 0x1800
+0x03c HandleCount : 1321
+0x040 Flags : 0
+0x040 StrictFIFO : 0y0
~ TableCode 값이 Handle Table Entries (최종엔트리) 인지 확인
~ 0x03 과 & 연산에서 0 인경우 최종엔트리
Evaluate expression: 1 = 00000001
~ 최종 엔트리가 아닌경우
~ 포인터 테이블의 주소값 연산
Evaluate expression: -510971904 = e18b3000
~ ObjectTable Pointer 값 확인
e18b3000 e1004000 e18b4000 e1a3e000 00000000
e18b3010 00000000 00000000 00000000 00000000
e18b3020 00000000 00000000 00000000 00000000
e18b3030 00000000 00000000 00000000 00000000
e18b3040 00000000 00000000 00000000 00000000
e18b3050 00000000 00000000 00000000 00000000
e18b3060 00000000 00000000 00000000 00000000
e18b3070 00000000 00000000 00000000 00000000
~ 다시 최종 엔트리인지 확인
Evaluate expression: 0 = 00000000
~ 최종 ObjectTable(HandleTableEntries) 확인
e1004000 00000000 fffffffe 867b5819 001f0fff
e1004010 867b4009 00000000 e14e3469 000f003f
e1004020 e1011459 00000000 e14ea419 00020019
e1004030 e14f1419 00020019 e1023441 0002001f
e1004040 e14e9129 00020019 e14e2151 00020019
e1004050 e14f6441 00020019 e14f2419 0002001f
e1004060 e14ff441 00020019 867e8239 001f0003
e1004070 8634ae89 0012019f 86366cd1 0012019f
0: kd> dd e18b4000
...
0: kd> dd e1a3e000
...
~ ENTRY 구조는 다음과 같이
4바이트 오브젝트(_OBJECT_HEADER), 4바이트 GrantAccess 구조이다
+0x000 Object : Ptr32 Void
+0x000 ObAttributes : Uint4B
+0x000 InfoTable : Ptr32 _HANDLE_TABLE_ENTRY_INFO
+0x000 Value : Uint4B
+0x004 GrantedAccess : Uint4B
+0x004 GrantedAccessIndex : Uint2B
+0x006 CreatorBackTraceIndex : Uint2B
+0x004 NextFreeTableEntry : Int4B
union {
PVOID Object;
ULONG ObAttributes;
};
union {
union {
ACCESS_MASK GrantedAccess;
struct {
USHORT GrantedAccessIndex;
USHORT CreatorBackTraceIndex;
};
};
LONG NextFreeTableEntry;
};
} HANDLE_TABLE_ENTRY, *PHANDLE_TABLE_ENTRY;
~ 단, 8바이트 오브젝트 포인터의 마지막 비트가 Lock Bit 이므로
~ 사용할때 & ~1 연산이 필요하다
~ 엔트리중 e1004000 + sizeof(_HANDLE_TABLE_ENTRY).
~ 즉, 첫번째 값을 보면
Evaluate expression: -2038736872 = 867b5818
+0x000 PointerCount : 89
+0x004 HandleCount : 2
+0x004 NextToFree : 0x00000002
+0x008 Type : 0x867b5e70 _OBJECT_TYPE
+0x00c NameInfoOffset : 0 ''
+0x00d HandleInfoOffset : 0 ''
+0x00e QuotaInfoOffset : 0 ''
+0x00f Flags : 0x22 '"'
+0x010 ObjectCreateInfo : 0x80562860 _OBJECT_CREATE_INFORMATION
+0x010 QuotaBlockCharged : 0x80562860
+0x014 SecurityDescriptor : 0xe1001bd2
+0x018 Body : _QUAD
+0x000 Mutex : _ERESOURCE
+0x038 TypeList : _LIST_ENTRY [ 0x867b5ea8 - 0x867b5ea8 ]
+0x040 Name : _UNICODE_STRING "Process"
+0x048 DefaultObject : (null)
+0x04c Index : 5
+0x050 TotalNumberOfObjects : 0x1e
+0x054 TotalNumberOfHandles : 0x79
+0x058 HighWaterNumberOfObjects : 0x20
+0x05c HighWaterNumberOfHandles : 0x80
+0x060 TypeInfo : _OBJECT_TYPE_INITIALIZER
+0x0ac Key : 0x636f7250
+0x0b0 ObjectLocks : [4] _ERESOURCE
~ Process Type의 Object 이므로
~ Object Header + sizeof(_OBJECT_HEADER) 주소, 즉 Body 주소를 캐스트한다
+0x000 Pcb : _KPROCESS
+0x06c ProcessLock : _EX_PUSH_LOCK
+0x070 CreateTime : _LARGE_INTEGER 0x0
+0x078 ExitTime : _LARGE_INTEGER 0x0
+0x080 RundownProtect : _EX_RUNDOWN_REF
+0x084 UniqueProcessId : 0x00000004
+0x088 ActiveProcessLinks : _LIST_ENTRY [ 0x86476558 - 0x805627b8 ]
+0x090 QuotaUsage : [3] 0
+0x09c QuotaPeak : [3] 0
+0x0a8 CommitCharge : 7
+0x0ac PeakVirtualSize : 0x537000
+0x0b0 VirtualSize : 0x1e4000
+0x0b4 SessionProcessLinks : _LIST_ENTRY [ 0x0 - 0x0 ]
+0x0bc DebugPort : (null)
+0x0c0 ExceptionPort : (null)
+0x0c4 ObjectTable : 0xe1003ea8 _HANDLE_TABLE
+0x0c8 Token : _EX_FAST_REF
+0x0cc WorkingSetLock : _FAST_MUTEX
+0x0ec WorkingSetPage : 0x6dc6
+0x0f0 AddressCreationLock : _FAST_MUTEX
+0x110 HyperSpaceLock : 0
+0x114 ForkInProgress : (null)
+0x118 HardwareTrigger : 0
+0x11c VadRoot : 0x867b11e8
+0x120 VadHint : 0x867b11e8
+0x124 CloneRoot : (null)
+0x128 NumberOfPrivatePages : 3
+0x12c NumberOfLockedPages : 0
+0x130 Win32Process : (null)
+0x134 Job : (null)
+0x138 SectionObject : (null)
+0x13c SectionBaseAddress : (null)
+0x140 QuotaBlock : 0x80562860 _EPROCESS_QUOTA_BLOCK
+0x144 WorkingSetWatch : (null)
+0x148 Win32WindowStation : (null)
+0x14c InheritedFromUniqueProcessId : (null)
+0x150 LdtInformation : (null)
+0x154 VadFreeHint : (null)
+0x158 VdmObjects : (null)
+0x15c DeviceMap : 0xe1002170
+0x160 PhysicalVadList : _LIST_ENTRY [ 0x867b5990 - 0x867b5990 ]
+0x168 PageDirectoryPte : _HARDWARE_PTE
+0x168 Filler : 0
+0x170 Session : (null)
+0x174 ImageFileName : [16] "System"
+0x184 JobLinks : _LIST_ENTRY [ 0x0 - 0x0 ]
...
~ "system" process 의 핸들임을 확인할 수 있다.
~ 마찬가지로 다른 핸들테이블엔트리를 확인하여 찾을 수 있다.
~ 끝
[참고]
1. 핸들 테이블 항목의 구조
0 8 16 24bit
[ -------- -------- -------- -------- ] // 개체 헤더에 대한 포인터
L AIP
[ -------- -------- -------- -------- ] // 엑세스 마스크
총 4B + 4B 의 8바이트로 구성됨.
L : Lock Bit
A : Audit Bit
I : Inherit Bit
P : Protect Bit
2. Win2K 의 경우
핸들테이블 -> 핸들테이블포인터 -> 핸들테이블포인터 -> 핸들테이블엔트리리스트
의 3단계 구조
WinXP/2k3 의 경우
1단계~3단계 가능하므로 0x3 Mask 로 확인
3. 핸들 테이블 항목의 최대 개수는
4KByte(1Page) 에 들어갈 수 있는 최대 개수로 결정되므로
핸들테이블엔트리사이즈(8Byte) / 4K(1Page) -> 511개 ( 맨 앞단 1개는 사용되지 않음 )
